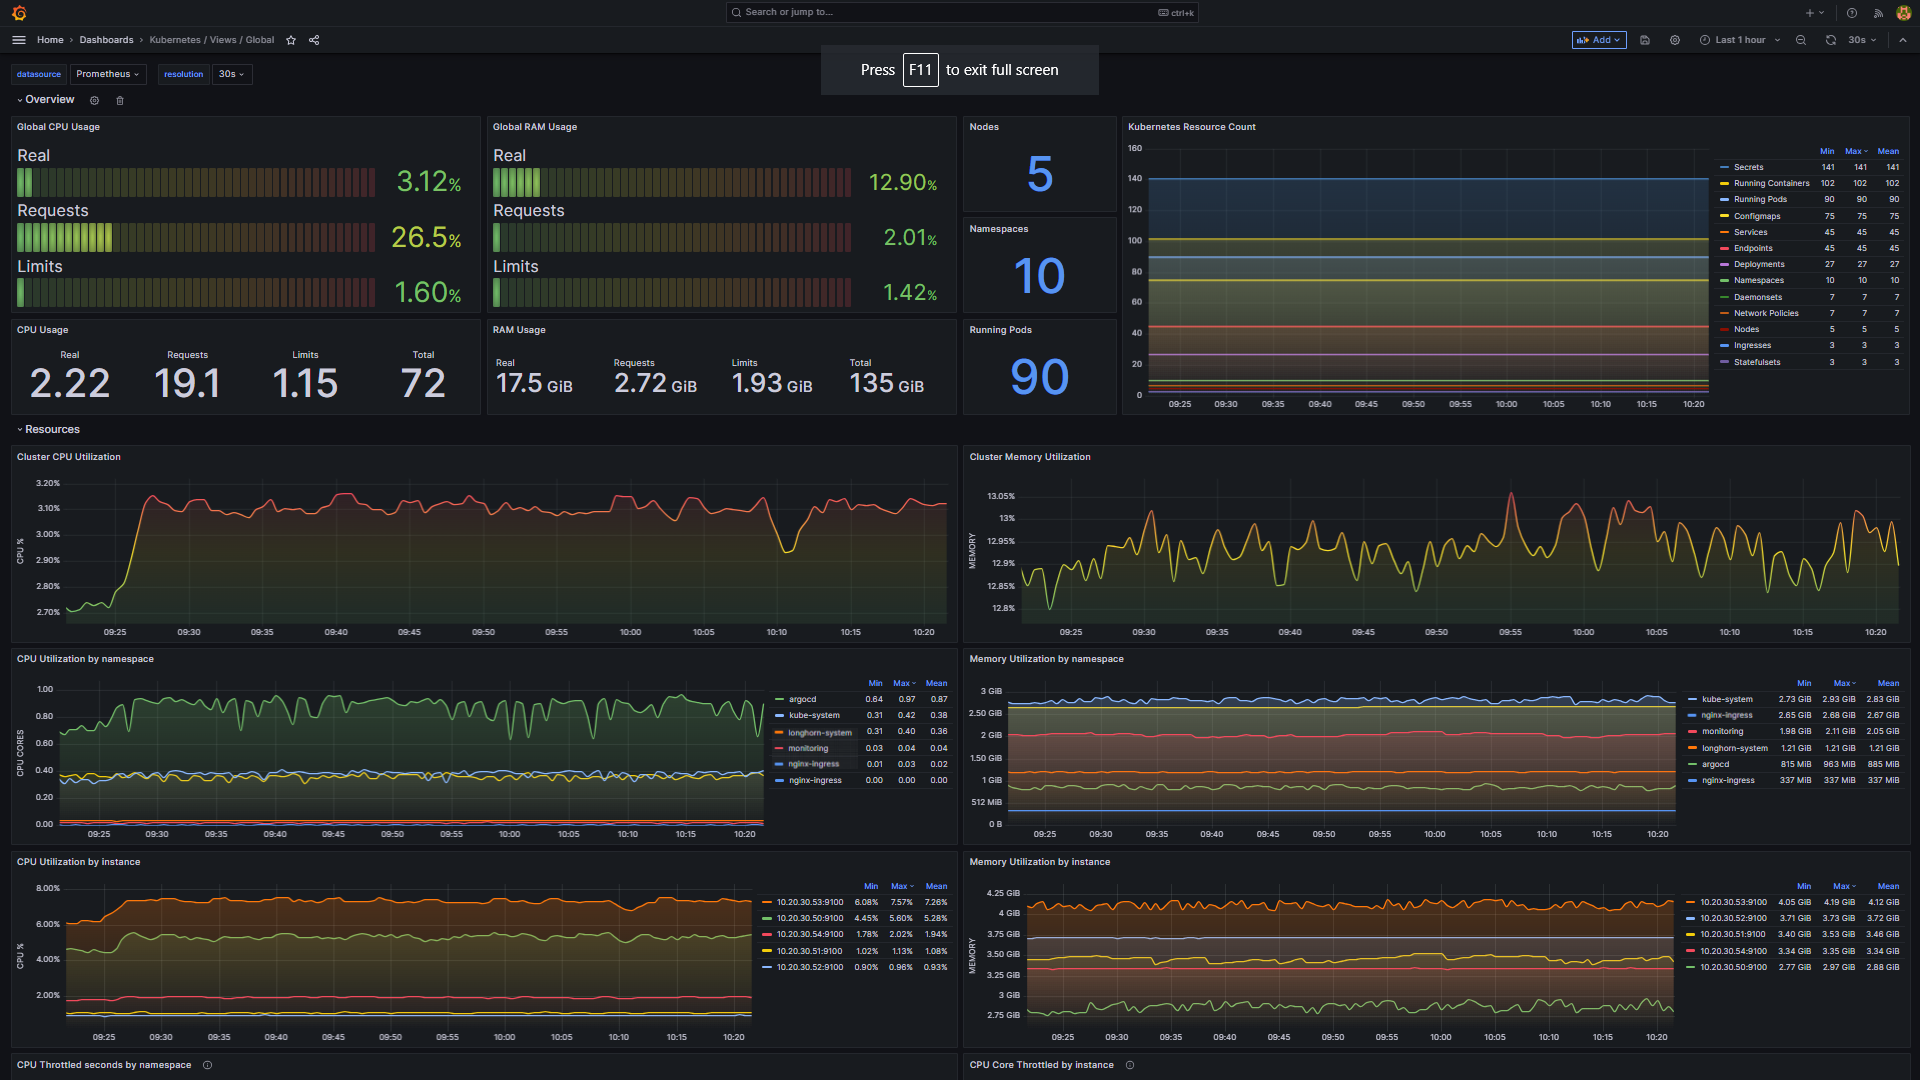

Overview
In this documentation, we will walk through the process of visualizing Kubernetes cluster metrics using two Helm charts: kube-prometheus-stack and grafana-dashboards-kubernetes. The kube-prometheus-stack provides an end-to-end monitoring solution that includes Kubernetes manifests, Grafana dashboards, and Prometheus rules, leveraging the Prometheus Operator for simplified deployment and configuration. On the other hand, grafana-dashboards-kubernetes offers a set of pre-configured Grafana dashboards specifically designed for Kubernetes.
This setup will enable us to monitor our Kubernetes cluster and visualize the metrics in Grafana using the pre-configured dashboards provided by both kube-prometheus-stack and grafana-dashboards-kubernetes.
Grafana Kubernetes Dashboards
Grafana Kubernetes Dashboards is a project that provides a set of modern and customizable dashboards for monitoring Kubernetes clusters with Grafana and Prometheus. It is based on other dashboards from the community and has an article explaining its features. The dashboards are compatible with the kube-prometheus-stack chart and require some metrics exporters to work.
You can also download them on Grafana.com.
Installation
ArgoCD
Deploying the grafana-dashboards-kubernetes, is going to be the easiest part of this setup; we’re going to use ArgoCD to deploy it. You can read about more ways to deploy this helm chart in the github documentation.
The official Application resource of this helm chart which you can also find the in the github repo:
apiVersion: argoproj.io/v1alpha1
kind: Application
metadata:
  name: grafana-dashboards-kubernetes
  namespace: argocd
  labels:
    app.kubernetes.io/name: grafana-dashboards-kubernetes
    app.kubernetes.io/version: HEAD
    app.kubernetes.io/managed-by: argocd
  finalizers:
  - resources-finalizer.argocd.argoproj.io
spec:
  project: default # You may need to change this!
  source:
    path: ./
    repoURL: https://github.com/dotdc/grafana-dashboards-kubernetes
    targetRevision: HEAD

  destination:
    server: https://kubernetes.default.svc
    namespace: monitoring
  syncPolicy:
    ## https://argo-cd.readthedocs.io/en/stable/user-guide/auto_sync
    automated:
      prune: true
      selfHeal: true
    syncOptions:
      - CreateNamespace=true
      - Replace=true
Since this is a public repository, you will not need to create a new connection in the ArgoCD Repositories.
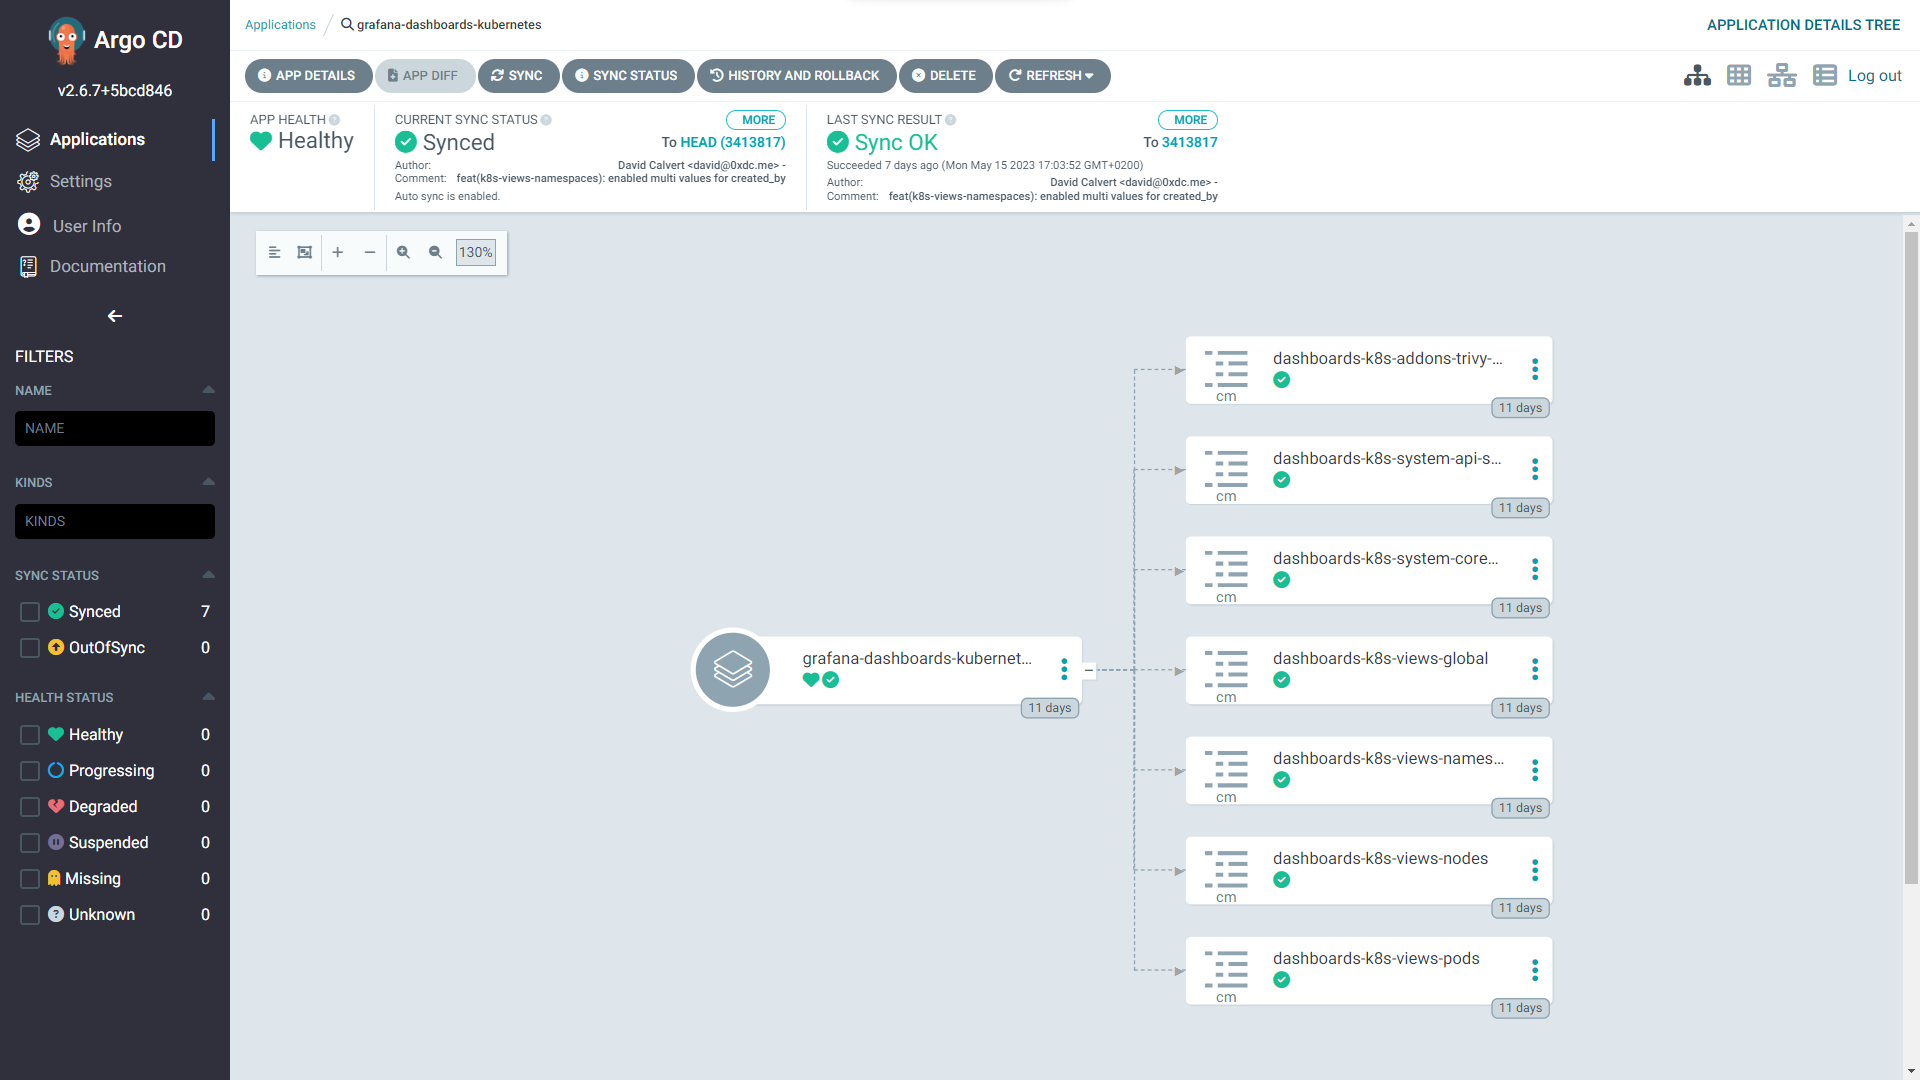
This is what the deployed application should look like:
Helm
To install this chart will helm, all you need to do is run command:
helm install <RELEASE_NAME> grafana-dashboards-kubernetes/ -n <NAMESPACE>Kube Prometheus Stack (AKA Prometheus Operator)
kube-prometheus-stack is a project that offers a complete solution for monitoring Kubernetes clusters with Prometheus and Grafana. It includes various components, dashboards, and rules that are easy to install and operate. It also uses the Prometheus Operator to manage the Prometheus instances and configuration. The project was previously called prometheus-operator, but it was renamed to avoid confusion with the operator component.
Installation
We're going to clone this repository so that we can modify its settings to suit our requirements.
git clone https://github.com/prometheus-community/helm-charts.git

cd helm-charts/charts/kube-prometheus-stack/
Before installing the helm chart we’re going to update the values.yaml file in this directory to use the grafana-dashboards-kubernetes configmaps.
# values.yaml

grafana:
  enabled: true
  namespaceOverride: ""
	dashboardProviders:
	    dashboardproviders.yaml:
	      apiVersion: 1
	      providers:
	      - name: 'grafana-dashboards-kubernetes'
	        orgId: 1
	        folder: 'Kubernetes'
	        type: file
	        disableDeletion: true
	        editable: true
	        options:
	          path: /var/lib/grafana/dashboards/grafana-dashboards-kubernetes
	  sidecar:
	    dashboards:
	      grafana-dashboards-kubernetes:
	        k8s-system-api-server:
	          url: https://raw.githubusercontent.com/dotdc/grafana-dashboards-kubernetes/master/dashboards/k8s-system-api-server.json
	          token: ''
	        k8s-system-coredns:
	          url: https://raw.githubusercontent.com/dotdc/grafana-dashboards-kubernetes/master/dashboards/k8s-system-coredns.json
	          token: ''
	        k8s-views-global:
	          url: https://raw.githubusercontent.com/dotdc/grafana-dashboards-kubernetes/master/dashboards/k8s-views-global.json
	          token: ''
	        k8s-views-namespaces:
	          url: https://raw.githubusercontent.com/dotdc/grafana-dashboards-kubernetes/master/dashboards/k8s-views-namespaces.json
	          token: ''
	        k8s-views-nodes:
	          url: https://raw.githubusercontent.com/dotdc/grafana-dashboards-kubernetes/master/dashboards/k8s-views-nodes.json
	          token: ''
	        k8s-views-pods:
	          url: https://raw.githubusercontent.com/dotdc/grafana-dashboards-kubernetes/master/dashboards/k8s-views-pods.json
	          token: ''
	      enabled: true
	      defaultFolderName: "General"
	      label: grafana_dashboard
	      labelValue: "1"
	      # Allow discovery in all namespaces for dashboards
	      searchNamespace: ALL
	      folderAnnotation: grafana_folder
Before installing this chart we first need to install the chart dependencies by running:
# In the kube-prometheus-stack/ directory

helm dependency build

helm install <RELEASE_NAME> kube-prometheus-stack/ -n <NAMESPACE>

# Check its status by running:
kubectl --namespace <NAMESPACE> get pods -l "release=<RELEASE_NAME>"
Once the resources have been created we can expose our kube-prometheus-stack grafana deployment as NodePort service by running:
# Get the name of our grafana pod
kubectl get deployment -n <NAMESPACE> | grep grafana

# Expose the deployment as a NodePort service
kubectl expose deployment <GRAFANA_DEPLOYMENT_NAME> --name grafana-nodeport-service --type NodePort --protocol TCP --port 80 --target-port 3000

# Get Internal Node IP
kubectl get nodes -o wide
NAME            STATUS   ROLES    AGE    VERSION   INTERNAL-IP
general   Ready    <none>   149d   v1.25.8   141.94.74.199

# Get grafana-nodeport-service
kubectl get svc -o wide | grep grafana-nodeport-service
grafana-nodeport-service    NodePort    10.152.183.61    <none>        80:30144/TCP
Now we can see our Grafana dashboards at http://<server_ip>:30144